Feature Correlation and Feature Importance Bias with Random Forests
In my last post, I investigated claims by Altmann, et al. that feature importance scores from Random Forests (RFs) were biased for categorical variables. I demonstrated that the bias was due to the encoding scheme.
Altmann, et al. also claimed that RFs are biased in the presence of correlation between variables. For my Ph.D. work with identifying important SNPs, I’m looking into RFs precisely because the individual SNPs are not stongly correlated with the output labels. Rather, we are hoping the combinations of SNPs values will be correlated with the output labels, suggesting some correlation between the SNPs themselves. Thus, it’s important to my work to investigate the potential for bias for correlated variables and methods for correcting for the bias.
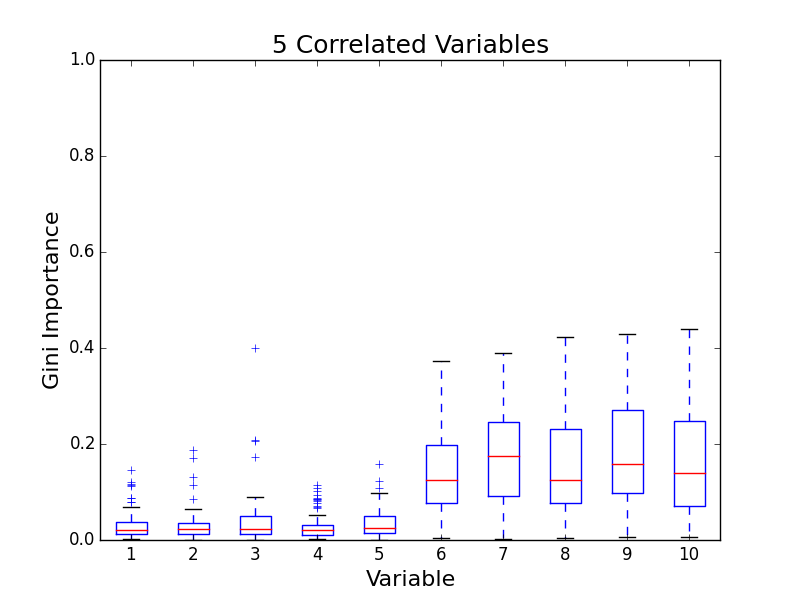
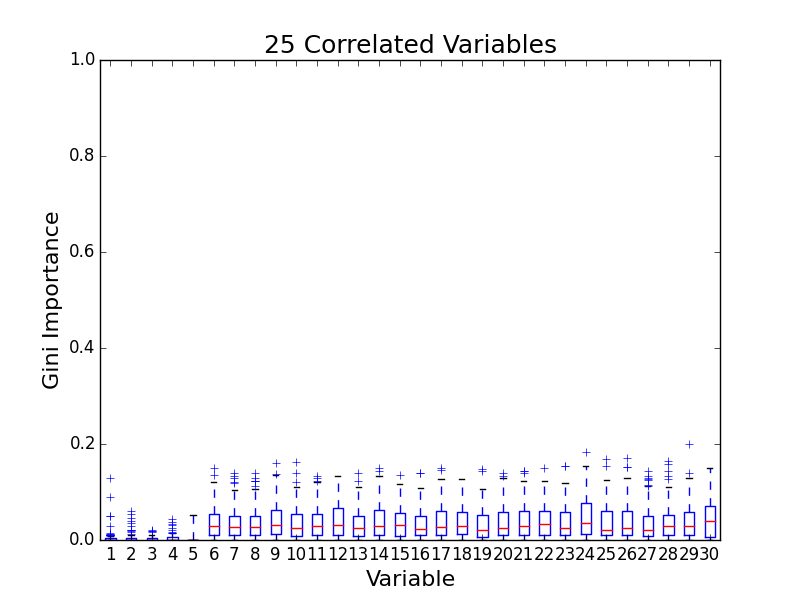
To test for feature importance score bias with correlated variables, I recreated Altmann, et al’s third experiment. I generated data sets with 5 uncorrelated variables and 1, 5, 10, and 25 correlated variables. The values for labels and uncorrelated variables were sampled uniformally from {0, 1}. The correlated variables were set to the label value. The feature importance value distributions from 100 simulations are shown in the following plots:
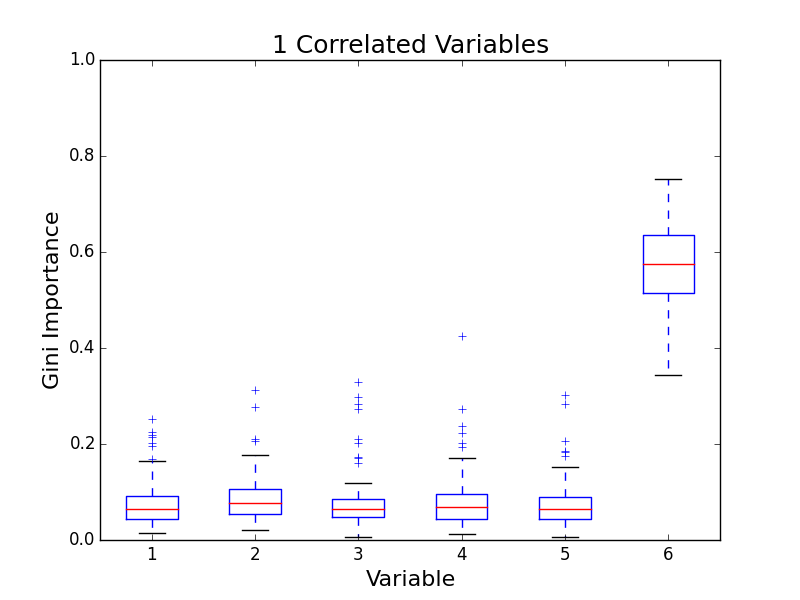
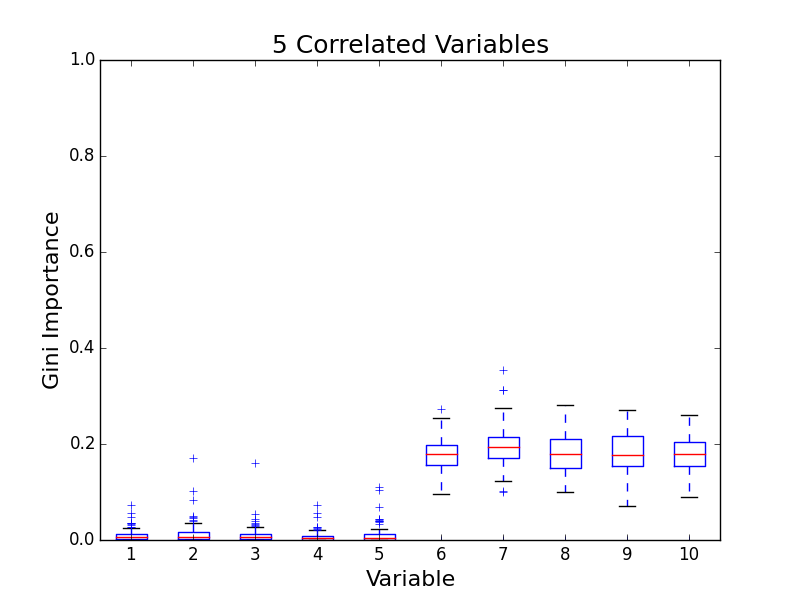
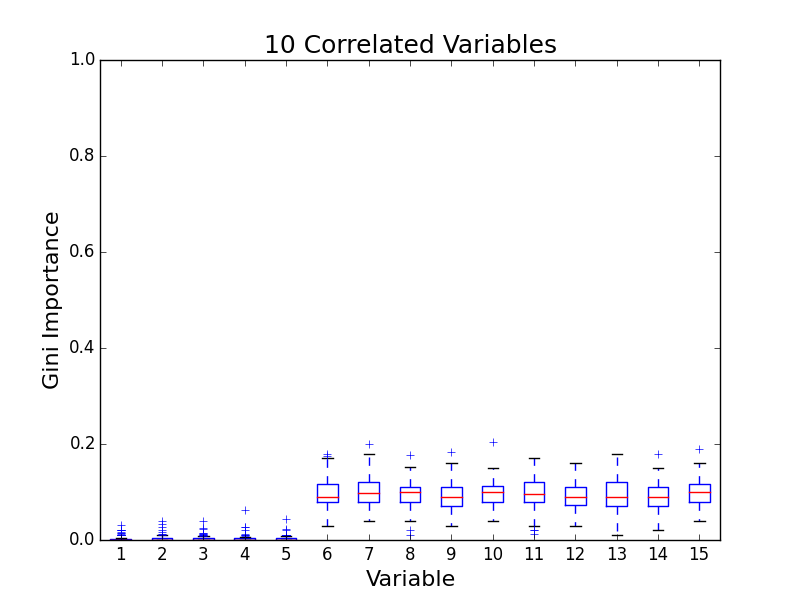
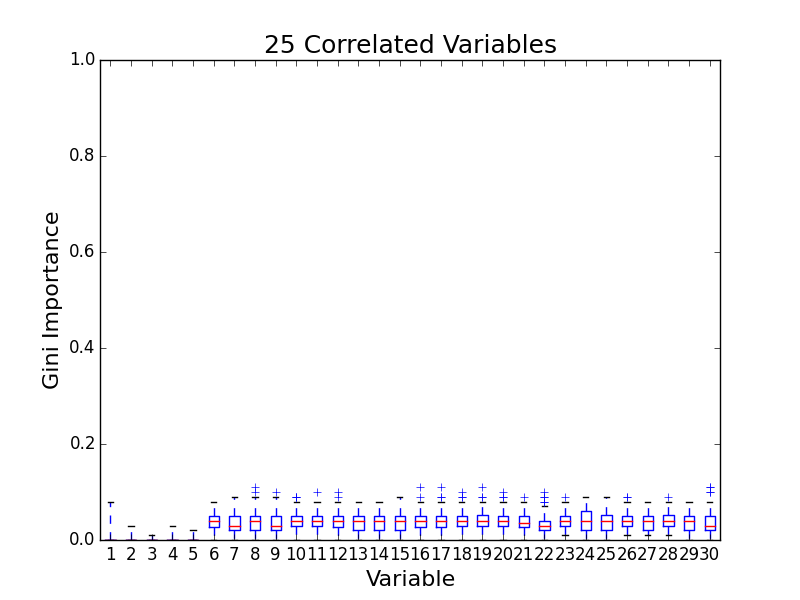
The first five variables for each plot are uncorrelated; the remaining variables are correlated. As the number of correlated variables increases, the feature importance score of the correlated variables goes down. I found evidence of bias! I also validated the third experiment of the paper by Altmann, et al.
The correlated variables are actually duplicates, however. To further validate my observation, I generated new data sets where the correlated variables have some noise. In this experiment, the correlated variables are set to the output label value 75% of the time and for the remaining 25% of time, the value is chosen uniformally from {0, 1}. (In actuality, this means that the features matched the output label 75% + 25% x 50% = 82.5% of the time.) The feature importance plots for 5 and 15 correlated variables are below.
The same pattern emerges – as the number of correlated variables increases, the feature importance score for each variable decreases. This pattern should be expected, however. The correlated variables provide similar information. When the decision trees are searching for optimal splits, the correlated variables are interchangeable. The net result is that if I have \(N\) correlated variables, each variable would be chosen with frequency \(1/N\) compared with having a single variable.
Unlike the number of categories, we have multiple options which offer trade offs. In particular, our solution to the problem will depend on how much we value the descriptive characteristics (feature selection) versus predictive power of our model. If we don’t care about feature selection, we can perform PCA and project the features onto the principal components (PCs) before using a RF. PCA will produce orthogonal vectors capturing the information that best explains the variation between samples. As a result, the PCA features won’t be correlated with each other. Unfortunately, interpreting the feature importance from PCs is not necessarily easy, limiting the value of PCA as a solution if having a descriptive model is important.
If feature selection is the primary goal, we can use an alternative approach. In the simplest case, we can identify duplicate variables and remove the duplicates.
I’ve also been thinking about an approach for the more complicated case of correlated but not duplicated values. I propose a three step approach. First, calculate the pairwise correlation between feature values using approaches such as Pearson’s correlation or Cramer’s V (for categorical values). Secondly, use the correlations as a similarity measure for clustering the features using Affinity propagation or any other clustering algorithm that depends only on distances between items. Lastly, replace the clusters of variables with a single instance or a categorical variable encoding all possible combinations of the raw variables’ values. Unlike PCA, the categorical variables can easily mapped back to the original features.
Unfortunately, this approach would causes a loss in predictive power. Not all possible permutations will be captured in the training data so the RFs won’t be able to interpret previously-unseen permutations like it could with the raw features.
For my work with SNPs, I’m lucky in two respects. First, I only care about feature selection. Secondly, from a biological standpoint, it’s known that SNPs can often be organized into groups called haplotypes based on their adjacency along chromosomes. As a result, I can utilize existing haplotype reconstruction programs to replace correlated variables which will be less computationally expensive than the general clustering-based approach I proposed above.
(I posted my code so you can recreate my results.)
PS – Tolosi, et al. also investigated bias with correlated features and proposed a similar feature clustering solution. I’m glad to see others had similar ideas. :)