Customer Segmentation with the BigPetStore Multinomial Model
In my recent posts, I described issues with BigPetStore’s product purchasing Markov model and described a multinomial model which seemed promising. To be useful, the product purchasing model needs to produce purchasing patterns that possess clear separations between groups and are amenable to analysis via common techniques in data science such as clustering. In this post, I’ll describe the result of such analyses on data generated by the multinomial model.
Experimental Setup
I created dry dog food products with 3 fields (brand, meat, grain) and 3 values per field for a total of 27 products. I created 3 sets of weights, one for each group of customers. For each group, I simulated 2700 customers, each with 10 product purchases.
For the clustering and PCA described below, I created a feature matrix with 8,100 samples (2,700 customers/group * 3 groups) and 27 features (one for each product). The elements represented the number of purchases of a particular product by a particular customer.
Product Purchasing Distributions
First, I plotted the distribution of the purchasing counts for the products for each group:
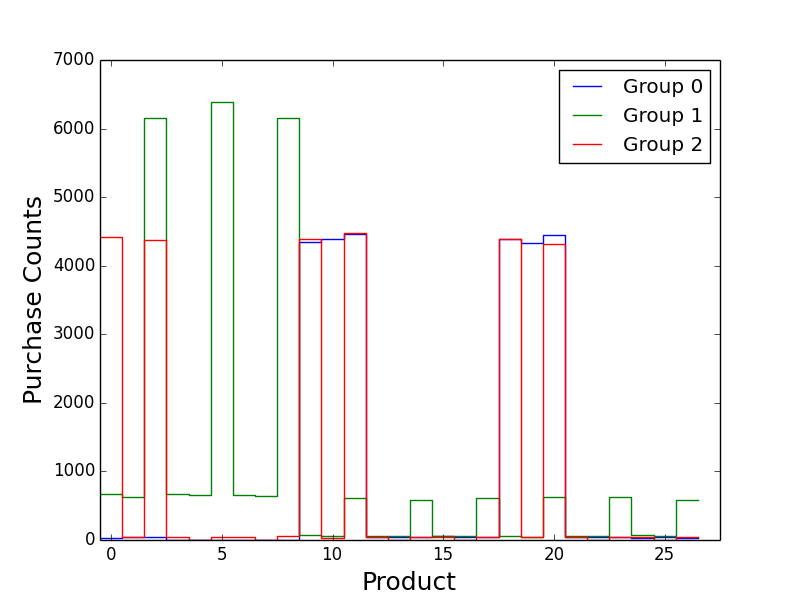
Group 1 is clearly separated from Groups 0 and 2. Group 0 and 2 are similar but have some differences. Group 0 favors products 10 and 19, unlike Group 2. Group 2 favors products 0 and 2 while Group 1 does not.
K-Means Clustering
I clustered the resulting customer purchasing data using K-means as implemented in scikit-learn. I used the standard Euclidean distance (although cosine similarity would also be interesting). I analyzed the clustering results by sweeping over 1 to 9 clusters and computed the “inertia” for each cluster count. A plot of the cluster sizes versus the inertia shows that inertia plateaus at 3 clusters, corresponding to our 3 customer groups:
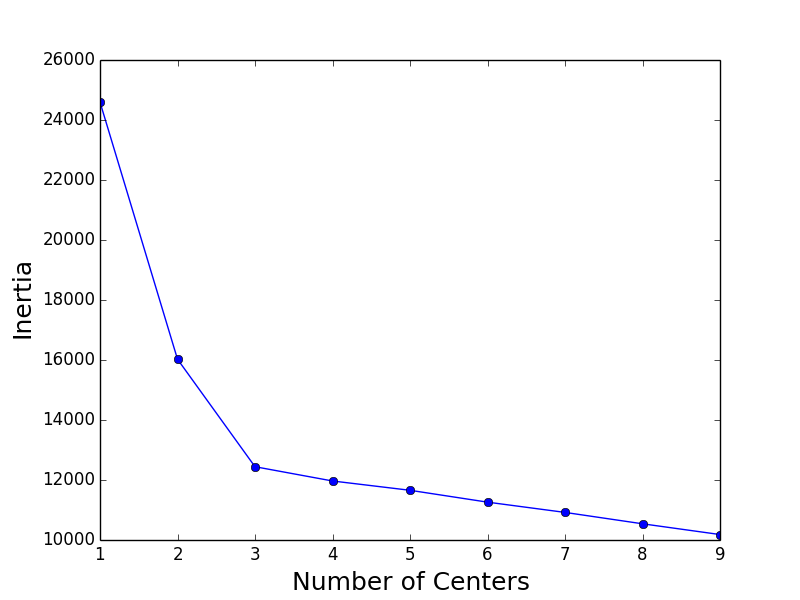
We get exactly the result we want!
Principal Component Analysis
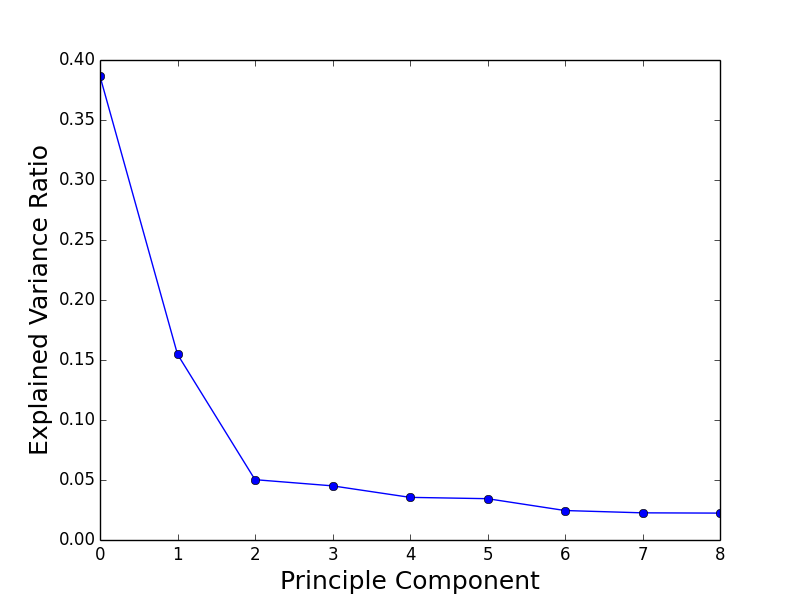
I also analyzed the generated data with Principal Component Analysis (PCA). The explain variance ratios of the principal components indicate that 2 principal components explain the data relatively well:
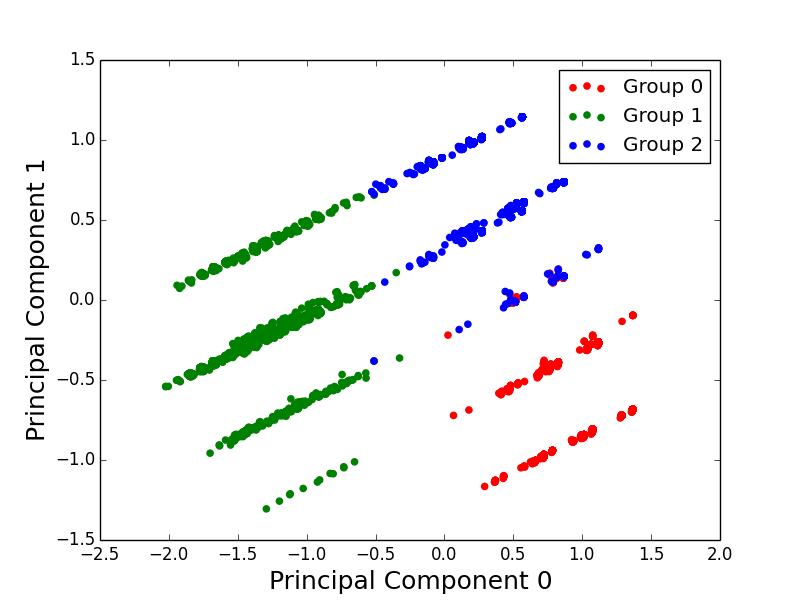
When projected onto the Principal Components, we can see clear separation between the 3 groups:
Conclusion
The multinomial model generates data with clearly separable distributions. This is a huge win and improvement over the current BigPetStore Markov models and exactly the results we want to see.