Classifying Graphs with Shortest Paths
Graphs can be an easy and intuitive way of representing interactions between agents or state transitions in sociological, biological, and dynamical systems. The Computer Science & Engineering department happens to have a number of researchers in the Interdisciplinary Center for Network Science and Applications (iCeNSA) working on complex networks. Between some of my own research modeling protein-folding dynamics as Markov State Models and having a desk in the iCeNSA office space, I was exposed to some of this research.
One of the most natural applications of network science is analyzing clickstream data. In particular, we can represent users’ browsing sessions as graphs. In the simplest case, we can use vertices to represent the pages that users have visited and directed edges to represent that a user has navigated from one page to another. A more sophisticated model might might use edge weights to record the number of times the user navigated from one page to another in a single session. In fact, if we normalize the outgoing edge weights of each vertex, we can derive a Markov model of the dynamics of the browsing session.
My motivation and goal of modeling users’ browsing sessions as graphs is to be able to segment users by their browsing behaviors. For example, I may want to train a machine learning model to discriminate between users who are likely to make a purchase (convert) versus those who are just window shopping using graphs generated from their browsing sessions. I don’t know the content of the web sites, and web sites can be structured differently. Thus, I won’t be able to match vertices between separate graphs easily. As such, I want to engineer features based purely on topological features of the graphs that are invariant to permutations of vertices and the number of edges and vertices in graphs.
There are several ways to approach classifying graphs with machine learning models. One approach is simply to engineer a bunch of features from different statistics computed from the graphs. Li, et al. describe a number of metrics including the average clustering coefficient and the average path length (closeness centrality). However, be aware that some of their features (such as the numbers of edges and vertices) probably won’t be useful if you are comparing graphs of different sizes.
A second approach would be to use graph kernels, functions for computing a similarity score between two graphs. A number of machine learning methods (called kernel methods) such as Support Vector Machines and Principal Component Analysis can be adapted to use inner products computed between pairs of data points using a kernel instead of feature vectors. Such kernel methods are advantageous since they enable these method to be extended to data types that are difficult to represent with traditional feature vectors. Often-cited graph kernels include Shortest-Paths, Graphlet, and [Random Walk]((https://en.wikipedia.org/wiki/Graph_kernel) kernels. At NIPS 2016, I saw a very nice presentation by Risi Kondor on the Multiscale Laplacian Graph Kernel, which both allows incorprating features computed on vertices and edges as well as adapting well to multi-scale problems like protein structures.
For this blog post, I’m going to focus on evaluating the ability of machine learning models to discriminate between undirected graphs generated by the Erdős–Rényi and planted partitioned random graph models. I’m using the experimental framework from a paper on the generalized Shortest-Path graph kernel. Instead of using graph kernels, I’m first going to focus on features engineered from the distribution of lengths of the shortest-paths between all pairs of vertices. Here are examples of two such graphs:
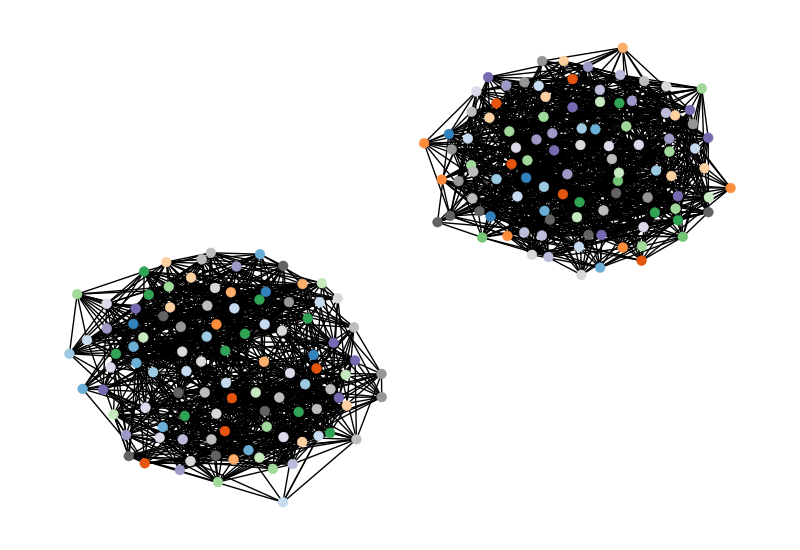
Generating the Graphs
I’m choosing to generate 100 graphs of each type. Each graph has 100 vertices. For the ER model, I’m using an edge probability of 0.2. Following the direction of the generalized shortest-path graph kernels paper, I set the parameters for the planted partitioned model to generate the same number of edges as the ER model, with a multiplier for \(p_1\) of 1.6.
Analysis of Shortest-Path Distributions
The distribution of the average of the all-pairs shortest-path lengths for each graph is plotted below:
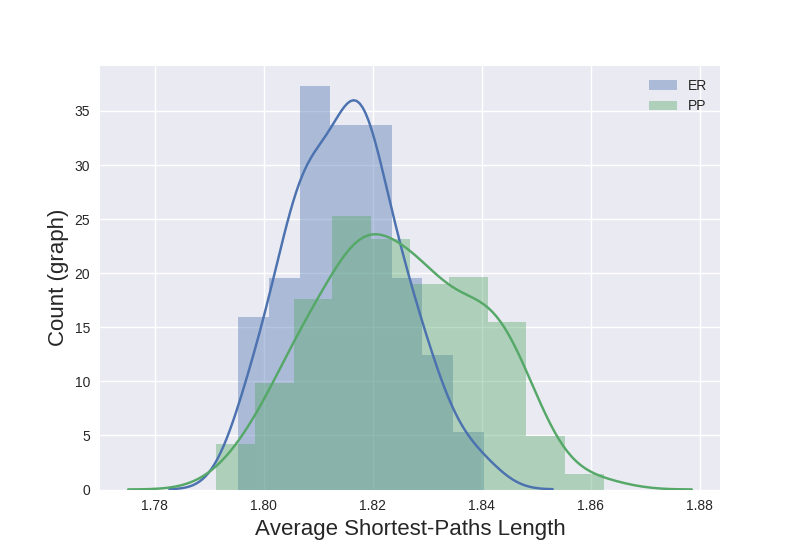
Note that the two distributions overlap substantially. Thus, simply using the average all-pairs shortest-path length for each graph won’t be able to effectively discriminate between graphs from the two classes.
I then decided to try generating a normalized histogram of the all-pairs shortest-path lengths for each graph. When I compared the distributions of the Euclidean distances of graphs generated by the same model to pairs from different models, I observed a separation in the distributions:
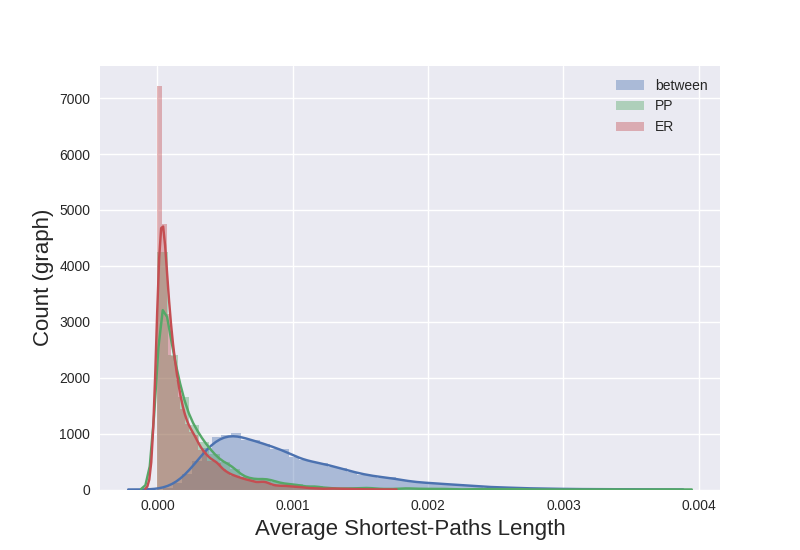
The difference in the distribution of distances for graphs from different models versus those generated by the same model was promising. I saw a similar result with cosine similarity.
Generating Features
As I mentioned earlier, instead of using a kernel method, I focused on generating features that could be used with standard machine learnign models. I focused on four modeling approaches:
- One feature vector for each graph. The features were the \(L_2\) normalized histogram of all-pairs shortest-path lengths. I used bin-sizes of 1 with enough bins to include the longest path found. (In my case, all of the graphs had the same maximum length of 3.) The ER graphs were labeled as 0, while the PP graphs were labeled as 1.
- Represent each pair of graphs as a feature vector. I computed the difference in the normalized histograms of the all-pairs shortest-paths lengths. Since the differences aren’t symmetric, I computed the differences each way and added two feature vectors for each pair. Feature vectors containing graphs from the same model were labeled 0, while feature vectors for graphs from different models were labeled 0.
- Same as #2, except that I took the absolute value of the differences and only added one feature vector per pair.
- Like approach #3, I used pairs of graphs. I used a single feature – the Euclidean distance calculated between the normalized histograms from each pair.
Experiments
I used Logistic Regression with Stochastic Gradient Descent and Random Forests for classification. I used 1,000 epochs for LR, and 100 trees for RF. I perfomed 10-fold stratified cross-fold validation and used accuracy and area under the ROC curve as metrics. Accuracy utilizes binary predictions, while the ROC AUC utilizes the predicted probabilities.
| Features Type | Classifier | ROC AUC (std) | Accuracy (%, std) |
|---|---|---|---|
| 1 | LR | 1.0 (0.0) | 98.0 (3.3) |
| 1 | RF | 1.0 (0.0) | 100.0 (0.0) |
| 2 | LR | 0.490 (0.006) | 66.7 (0.0) |
| 2 | RF | 0.999 (0.0) | 99.3 (0.0) |
| 3 | LR | 0.910 (0.007) | 71.1 (0.4) |
| 3 | RF | 0.999 (0.0) | 99.2 (0.0) |
| 4 | LR | 0.914 (0.005) | 66.7 (0.0) |
| 4 | RF | 0.921 (0.002) | 84.4 (0.4) |
LR performed well with feature type 1 with an average ROC AUC of 1.0 and average accuracy of 98.5%, but performed poorly on all other feature types. RFs performed well with feature types 1-3, achieving a minimum average ROC AUC of 0.999 and average accuracy of 99.2%.
We see these results reflected in ROC curves generated for each classifier from one of its 10 folds:
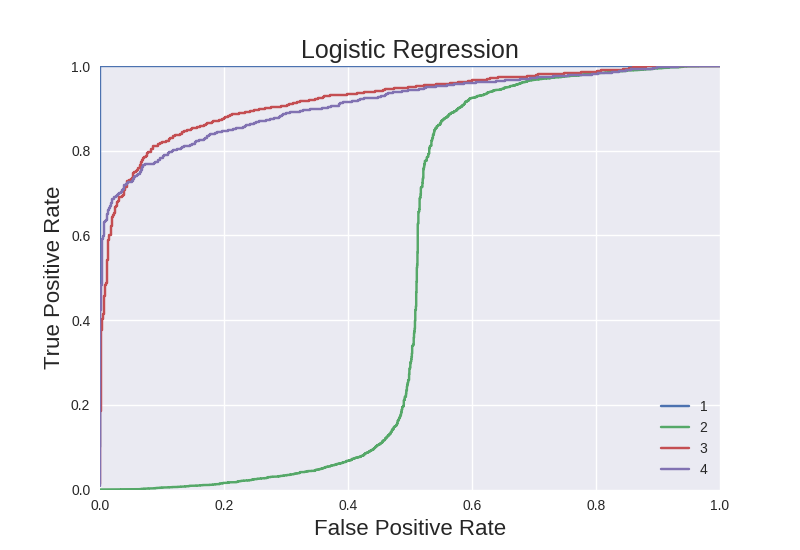
The LR classifier has an abysmal ROC curve for feature type 2. The ROC curves for features types 3 and 4 are decent. The ROC curve for feature type 1 appears to be perfect. (Note that the ROC curves are based on sorting by predicted probabilities, while the accuracies used the binary labels.)
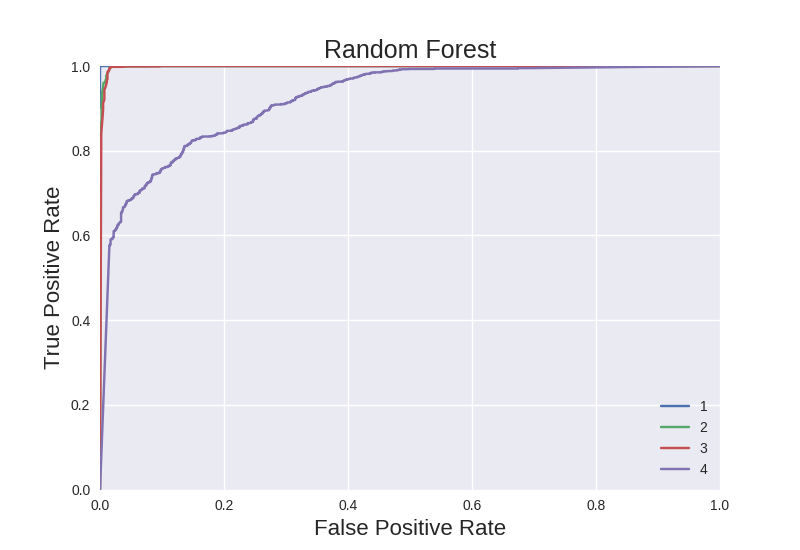
The RF model performes nearly perfectly on feature type 1, as indicated by the barely visible curve in the upper left of the plot. The ROC curve for feature types 2 and 3 are nearly perfect. The ROC curve for feature type 4 is acceptable, largely an indication of how robust RF classifiers are.
In terms of computational complexity, feature type 1 only requires creating a feature vector for each graph. Feature types 2-4 require computing a feature vector or distance for each pair of graphs.
Overall, it looks like feature type 1, where the feature vectors are the normalized histograms (bin size 1) of the all-pairs shortest-path lengths for each graph can be used to very accurately discriminate between graphs generated by the two models, regardless of the classifier used.
Conclusion
In this blog post, I looked at training machine learning models to discriminate between graphs generated by two different random graph models. I gave some background on feature engineering and kernel methods for graphs. I looked at four ways of representing the problem and how the corresponding features would be generated. I evaluated the four types of features using Logistic Regression and Random Forest classifiers. I observed that both LR and RF classifiers performed well when normalized histograms of the all-pairs shortest-paths lengths were used as features.
Going forward, I’d like to evaluate additional types of features such as the average clustering coefficient and the distributions of graphlets found in the graphs. Using the feature-vector per pair approach (feature type 3), I could incorporate graph kernels as features. However, I would probably need to find a different way to represent the absolute differences in the histograms so that it’s feasible to use Logistic Regression. One may to do so might be to discretize the differences for each bin in the histogram into a set of bins.
Once I have a reasonable set of useful features, I’d like to explore the effectiveness of this approach on small graphs since most user browsing sessions have far fewer than 100 nodes (e.g., 10).
The scripts used in the analyses are available in my graph-experiments repo on GitHub under the Apache Public License v2.