Cramer's V vs FST for Insect Population Genetics
Fixation index, or FST, is a univariate statistic calculated as the ratio of variance within populations to the variance between populations. Within insect population genetics, FST is used to score, and then rank, the correlation between variants and the population structure.
The focus of my Ph.D. dissertation was to investigate variable importance measures as calculated via Random Forests as an alterative to FST. I’ve also begun looking at Logistic Regression Ensembles.
In addition to these two machine learning approaches, I wanted to investigate a statistical method, Cramer’s V. Cramer’s V measures the assocation (correlation of unsigned variables) of nominal (categorical) variables. I went ahead and implemented Cramer’s V in the dev branch of my population methods exporation toolkit Asaph.
I used the Burkina Faso An. gambiae and An. coluzzii samples from the Anopheles gambiae 1000 genomes project to compare Cramer’s V and FST. I calculated the FST scores for each SNP using vcftools. I calculated Cramer’s V using Asaph on data imported using both the counts and categories feature encoding schemes. I then plotted FST vs Cramer’s V (counts) and FST vs Cramer’s V (categories) to get a sense of the correlation between the two metrics.
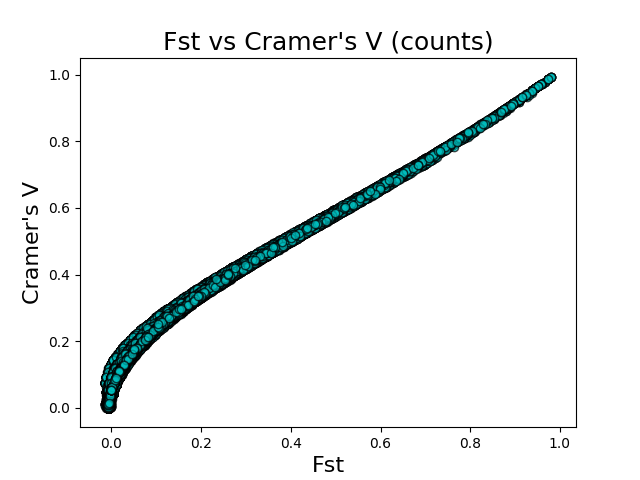
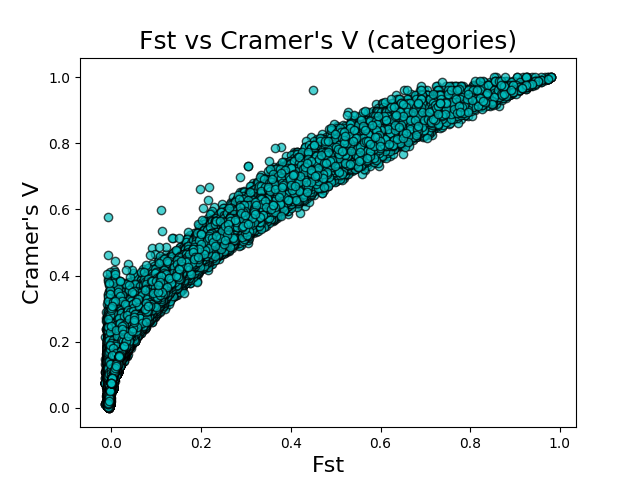
The above figures give the scatter plots of FST vs Cramer’s V with the counts and categories feature encodings, respectively. Cramer’s V calculated on the count-encoded features has a \(r^2\) value of 0.865 vs FST, while Cramer’s V calculated on the count-encoded features has a \(r^2\) value of 0.818 vs FST.
Conclusion
Along with Random Forests and Logistic Regression Ensembles, Cramer’s V is another alternative to FST for finding variants that best describe the genetic basis of differences between two populations. Cramer’s V correlates well with FST, but a simple correlation analysis doesn’t tell us which metric is more appropriate for a given situation. Substantial work remains to validate the four methods and compare them.